About the project
This portfolio documents my contributions to NUStudy, a learning application. Our team of 5 software engineering students from the National University of Singapore (NUS) were asked to enhance an Addressbook application with Command Line Interface (CLI) as the primary mode of input as part of our Software Engineering project in CS2103T. We had to conceptualize and implement enhancements to the existing Addressbook application and do it in a manner such that future developers can continue working on it. After some deliberation, we decided to morph it into an application to facilitate learning for students. The morphed application, NUStudy, enables students to add and manage notes; test their knowledge with questions that they have added; get statistics of how well they have answered these questions; and set tasks to plan their revision schedule.
I contributed to this project by implementing the statistics feature as documented below.
In particular, I have implemented the stats, question, report and overview commands.
The following sections will elaborate more on these enhancements
and showcase some documentations that I have added to the user and developer guides in
relation to these enhancements.
Key to symbols and formatting used:
stats: A grey highlight indicates that this is a command that can be inputted
into the command line and executed by the application.
(#1): A hash followed by a number indicates a pull request or an issue.
Summary of contributions
This section shows the enhancements I have added to the project as well as my other contributions.
Enhancement added: I added the ability to get statistics of the questions done in the quizzes.
-
What it does: The different commands allow users to filter the quiz results and return an overview of how well they have done the questions.
-
Justification: The
questionandreportcommands help users to get an idea of what subjects they are weaker in and see the common mistakes that they have made. Thestatsandoverviewcommands gives users an idea of which questions they should attempt more of and what subjects they have been neglecting. Overall, the statistics feature helps to provide users with a rough outline of their progress in mastering the subject. -
Highlights: This enhancement affects existing commands and commands to be added in future. An in-depth analysis of design alternatives is required in the future. The implementation was also challenging as it required many changes to existing models, logic classes and the UI.
Code contributed: Please click this link to see a sample of my code: here
Other Contributions:
-
Role:
-
I was in charge of code quality. My job was to make sure that the code follows a consistent style, is easy to understand and is well-documented.
-
-
Community:
-
Enhancements to existing features:
-
Updated the GUI so that different panels can be stacked: #56
-
User guide contributions
We have modified the existing Addressbook User Guide to include commands for the enhancements that we have added as well as remove the old commands that were not relevant to our project. Given below shows my additions to the NUStudy User Guide for the statistics feature.
Statistics
After doing some quizzes, you can get statistics of the questions that you have done in the app. The statistics functions listed below are used to filter the type of statistics that you want to get.
To close any statistics panel, you can simply type any of the commands from the Lecture notes,
Questions and Revision tasks features. E.g. rlist.
|
Quiz results stored in the app are not synchronised with the questions.
If you have modified a question using the editq command,
the stored quiz result will still refer to the original question.
This is because a question that has been modified might cause past
answers to become irrelevant and distort the statistics.
|
Getting statistics for subjects : stats
You can get a breakdown of the questions that you have done by its results.
If you want to narrow the results down, you can also choose to get the statistics for a difficulty
level by adding d/ or get the statistics of different subjects by adding s/.
Format: stats [d/DIFFICULTY] [s/SUBJECT1] [s/SUBJECT2]…
Example:
Let’s say you have answered some questions from CS2103T previously and would like
a ballpark figure to estimate how well you have grasp the basic foundations of the subject.
To get this figure:
-
Type
stats d/easy s/cs2103tinto the command box, and pressEnterto execute it. -
The result box will display the message "Here are the statistics: [easy] [cs2103t]"
-
And you can see a pie chart of the number of correctly and incorrectly answered questions.
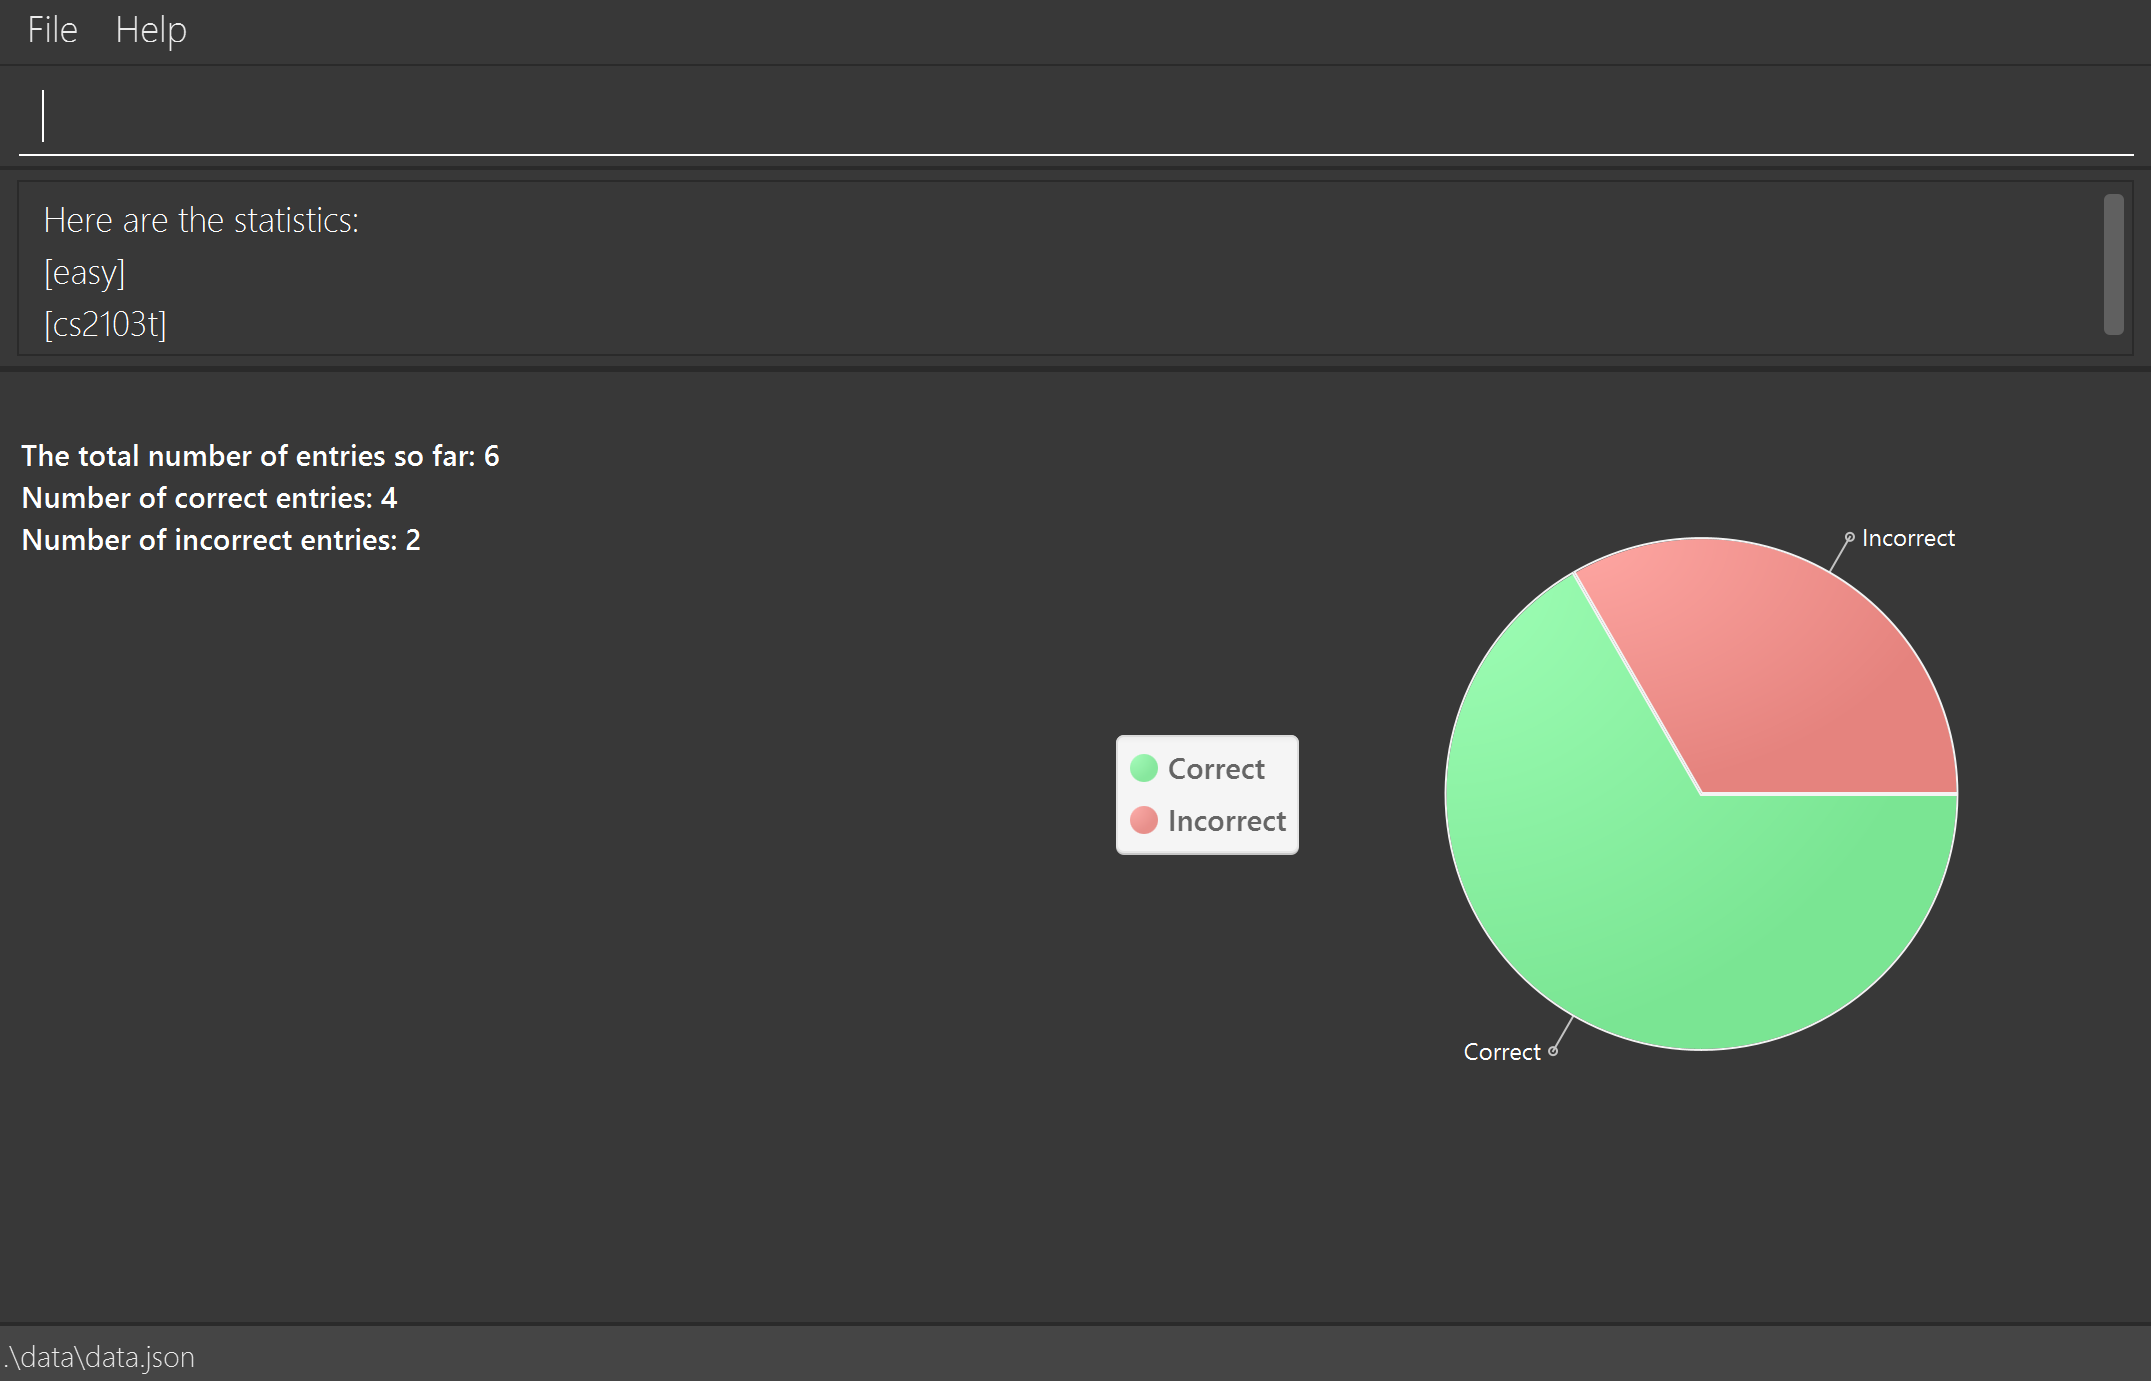
stats d/easy s/cs2103t commandGetting questions with correct/incorrect answers: question
You can get all questions that have been answered correctly/incorrectly by using -c/-i respectively.
Either one of -c or -i must be used. You can also filter by subjects by adding s/.
Format: question [-c] [-i] [s/SUBJECT1] [s/SUBJECT2]…
Example:
Now that you have gotten the number of correct to incorrect answers, you want to see what questions
you have done incorrectly to decide on how you can further improve.
To see the questions:
-
Type
question -i s/cs2103tinto the command box, and pressEnterto execute it. -
The result box will display the message "Here are the incorrect questions for [cs2103t]:"
-
You will be able to see a list of all your incorrectly answered questions for CS2103T and your past answers to it as well as a breakdown of the number of questions by difficulty level.
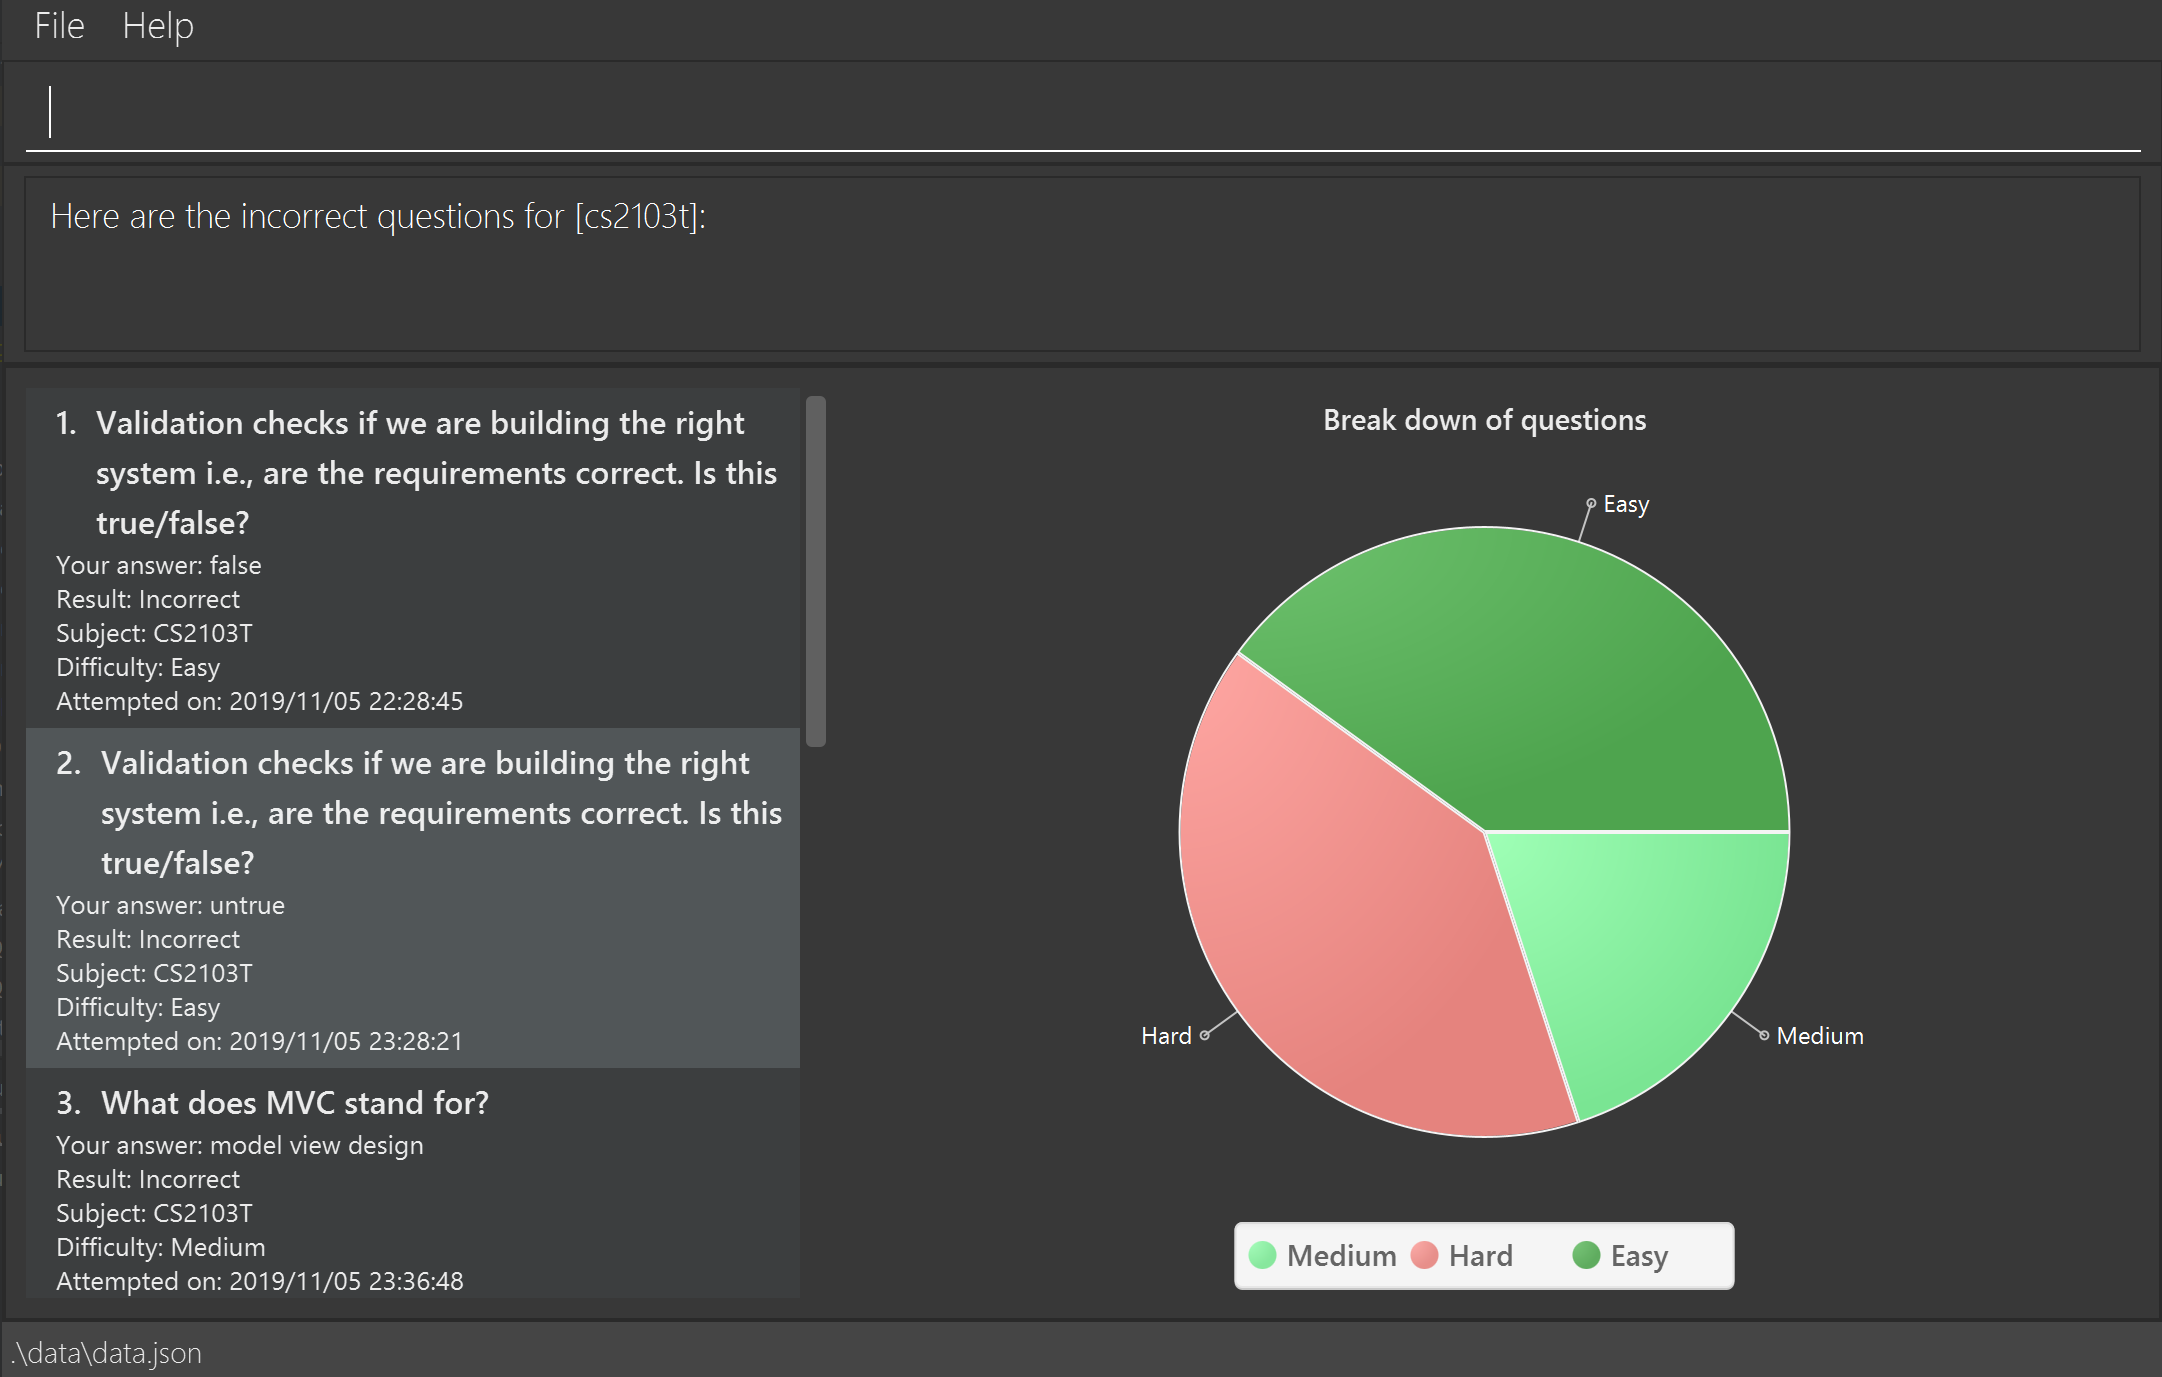
question -i s/cs2103tGetting a report of individual questions: report
You can get a report of how well you have answered a particular question
and see all your past answers to the question.
Format: report INDEX
Example:
After getting the questions that you have done wrong, you noticed that there is one particular
question that you have answered incorrectly numerous times. This just so happened to be the seventh
question in the question list. You decided to investigate further.
To see a report of the question 7:
-
Type
report 7into the command box, and pressEnterto execute it. -
The result box will display the message "Here is a report of question 7:"
-
And you can see all your attempts at the question as well as a pie chart of your results.
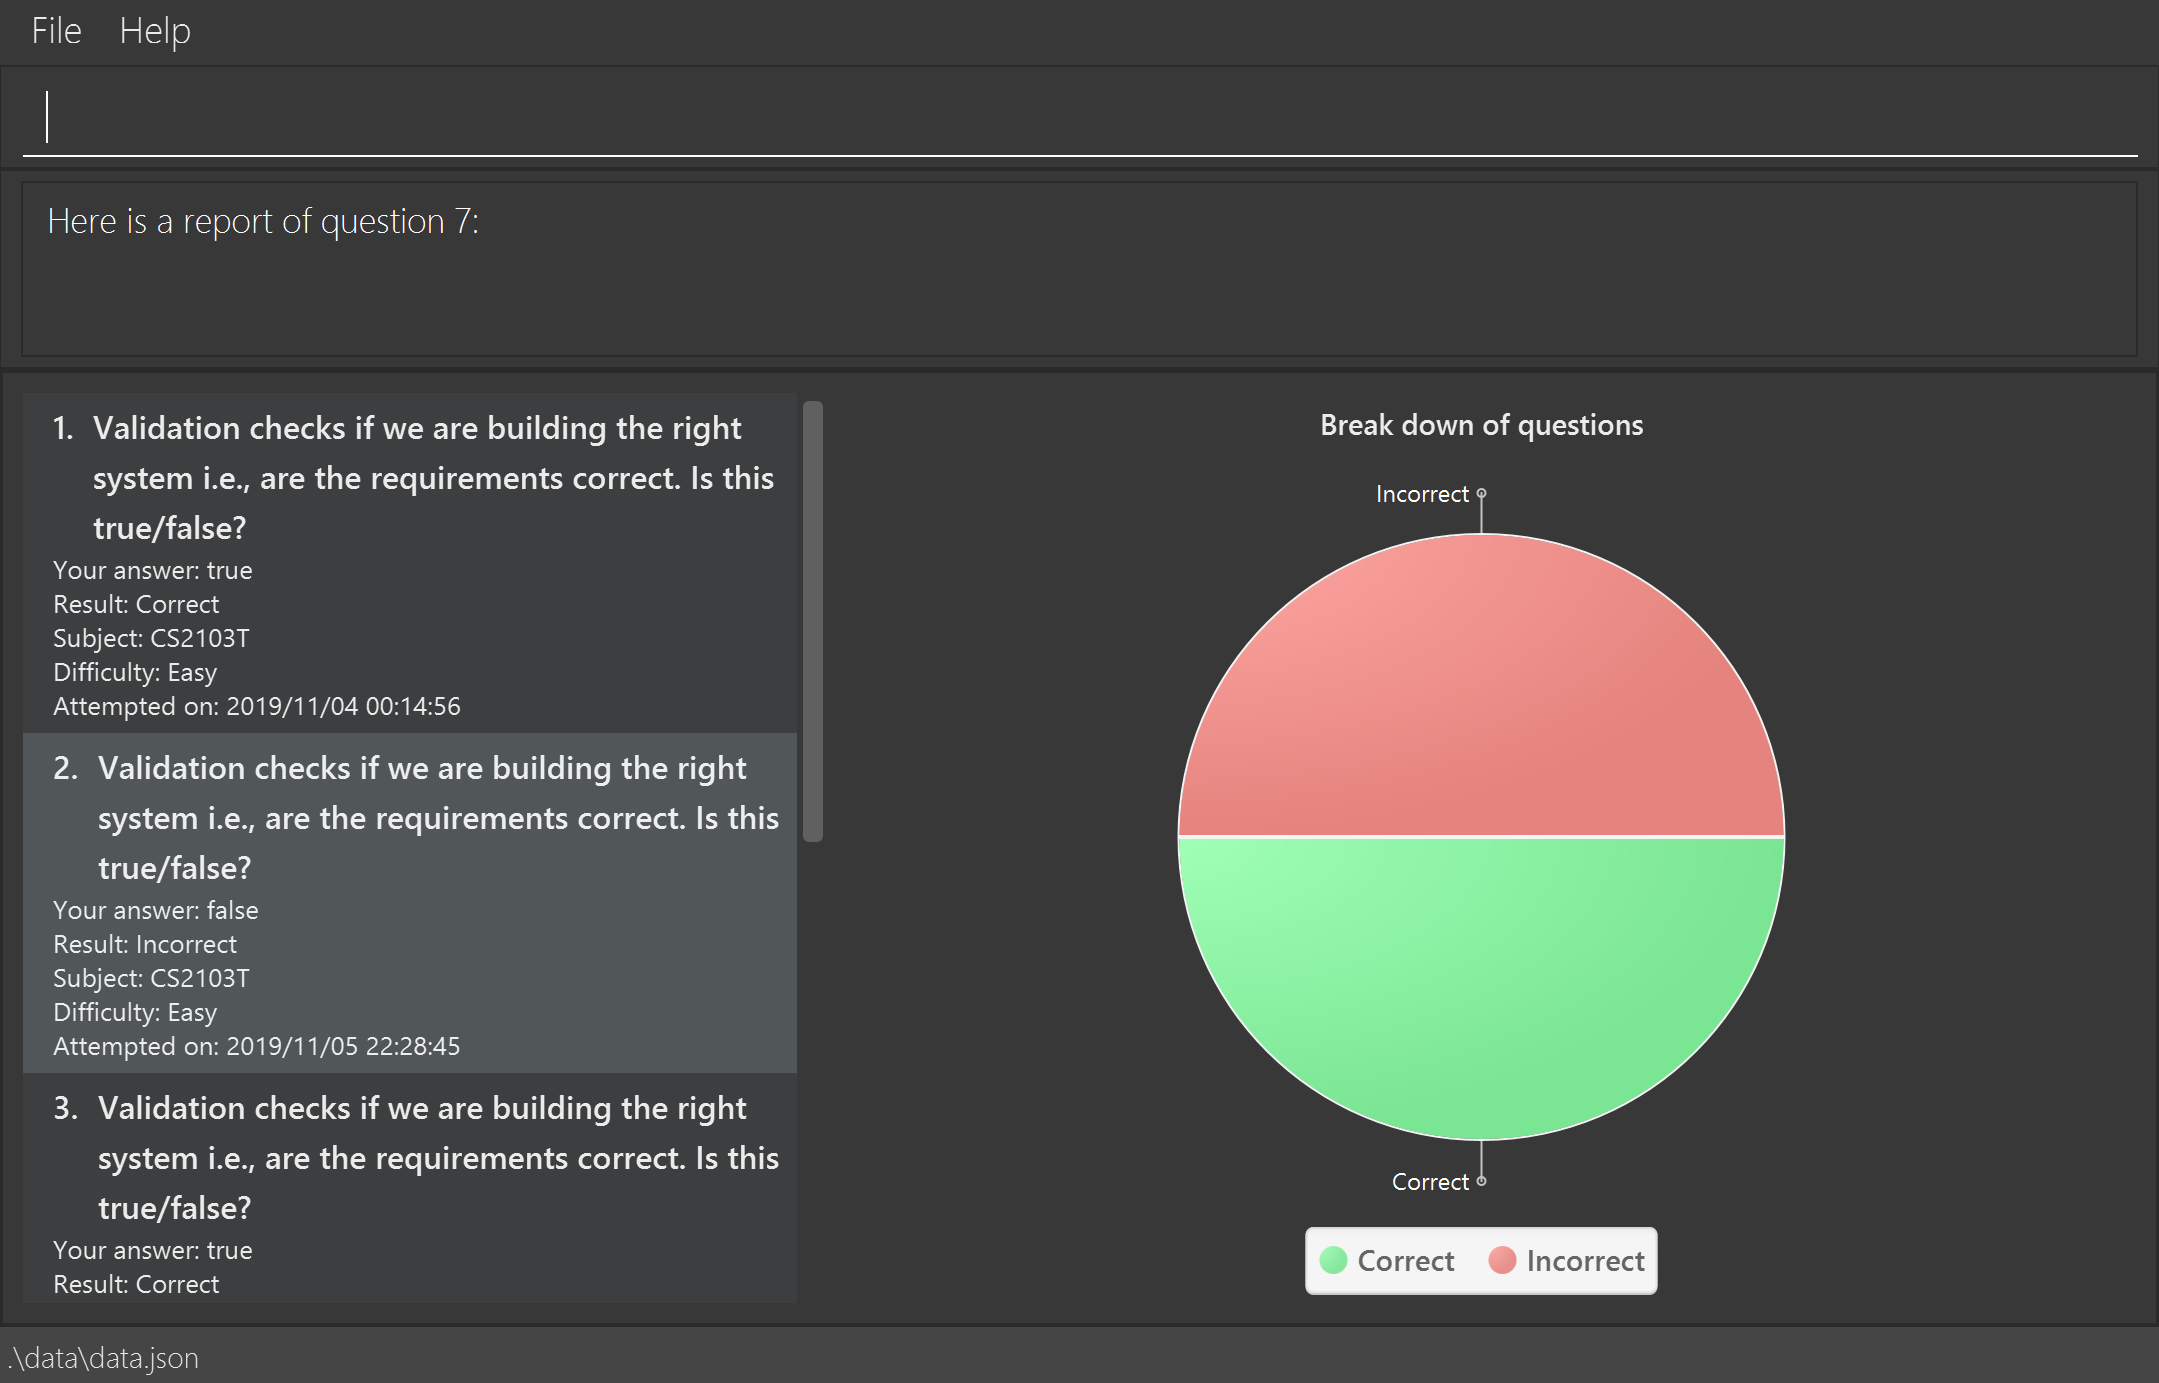
report 7 commandGetting overview of questions attempted: overview
You can get an overview of the types of questions that you have attempted overall.
A panel containing a stacked bar graph, sorted by subjects will be returned.
You can also add two dt/ fields representing a time period to get questions you did
within that time period. The format for date is dd/MM/yyyy.
Format: overview [dt/START_DATE dt/END_DATE]
For date input constraints, you may refer to [Adding a revision task for a note: rn].
|
| If you have more than 8 different difficulty levels, the stack bar chart may repeat colors for the difficulties. To differentiate between the different bars in the chart, you can use your mouse to hover above them. |
Example:
You are finally done viewing your quiz results and want to know what questions you should attempt next.
To be a well-rounded individual, you decided to check if you have been neglecting any subjects recently.
To see an overview of your results:
-
Type
overview dt/20/10/2019 dt/06/11/2019into the command box, and pressEnterto execute it. -
The result box will display the message "Here is an overview of the questions: (20/10/2019 to 06/11/2019)"
-
And you can see a stack bar chart of all questions that you have attempted from 20/10/2019 to 06/11/2019.
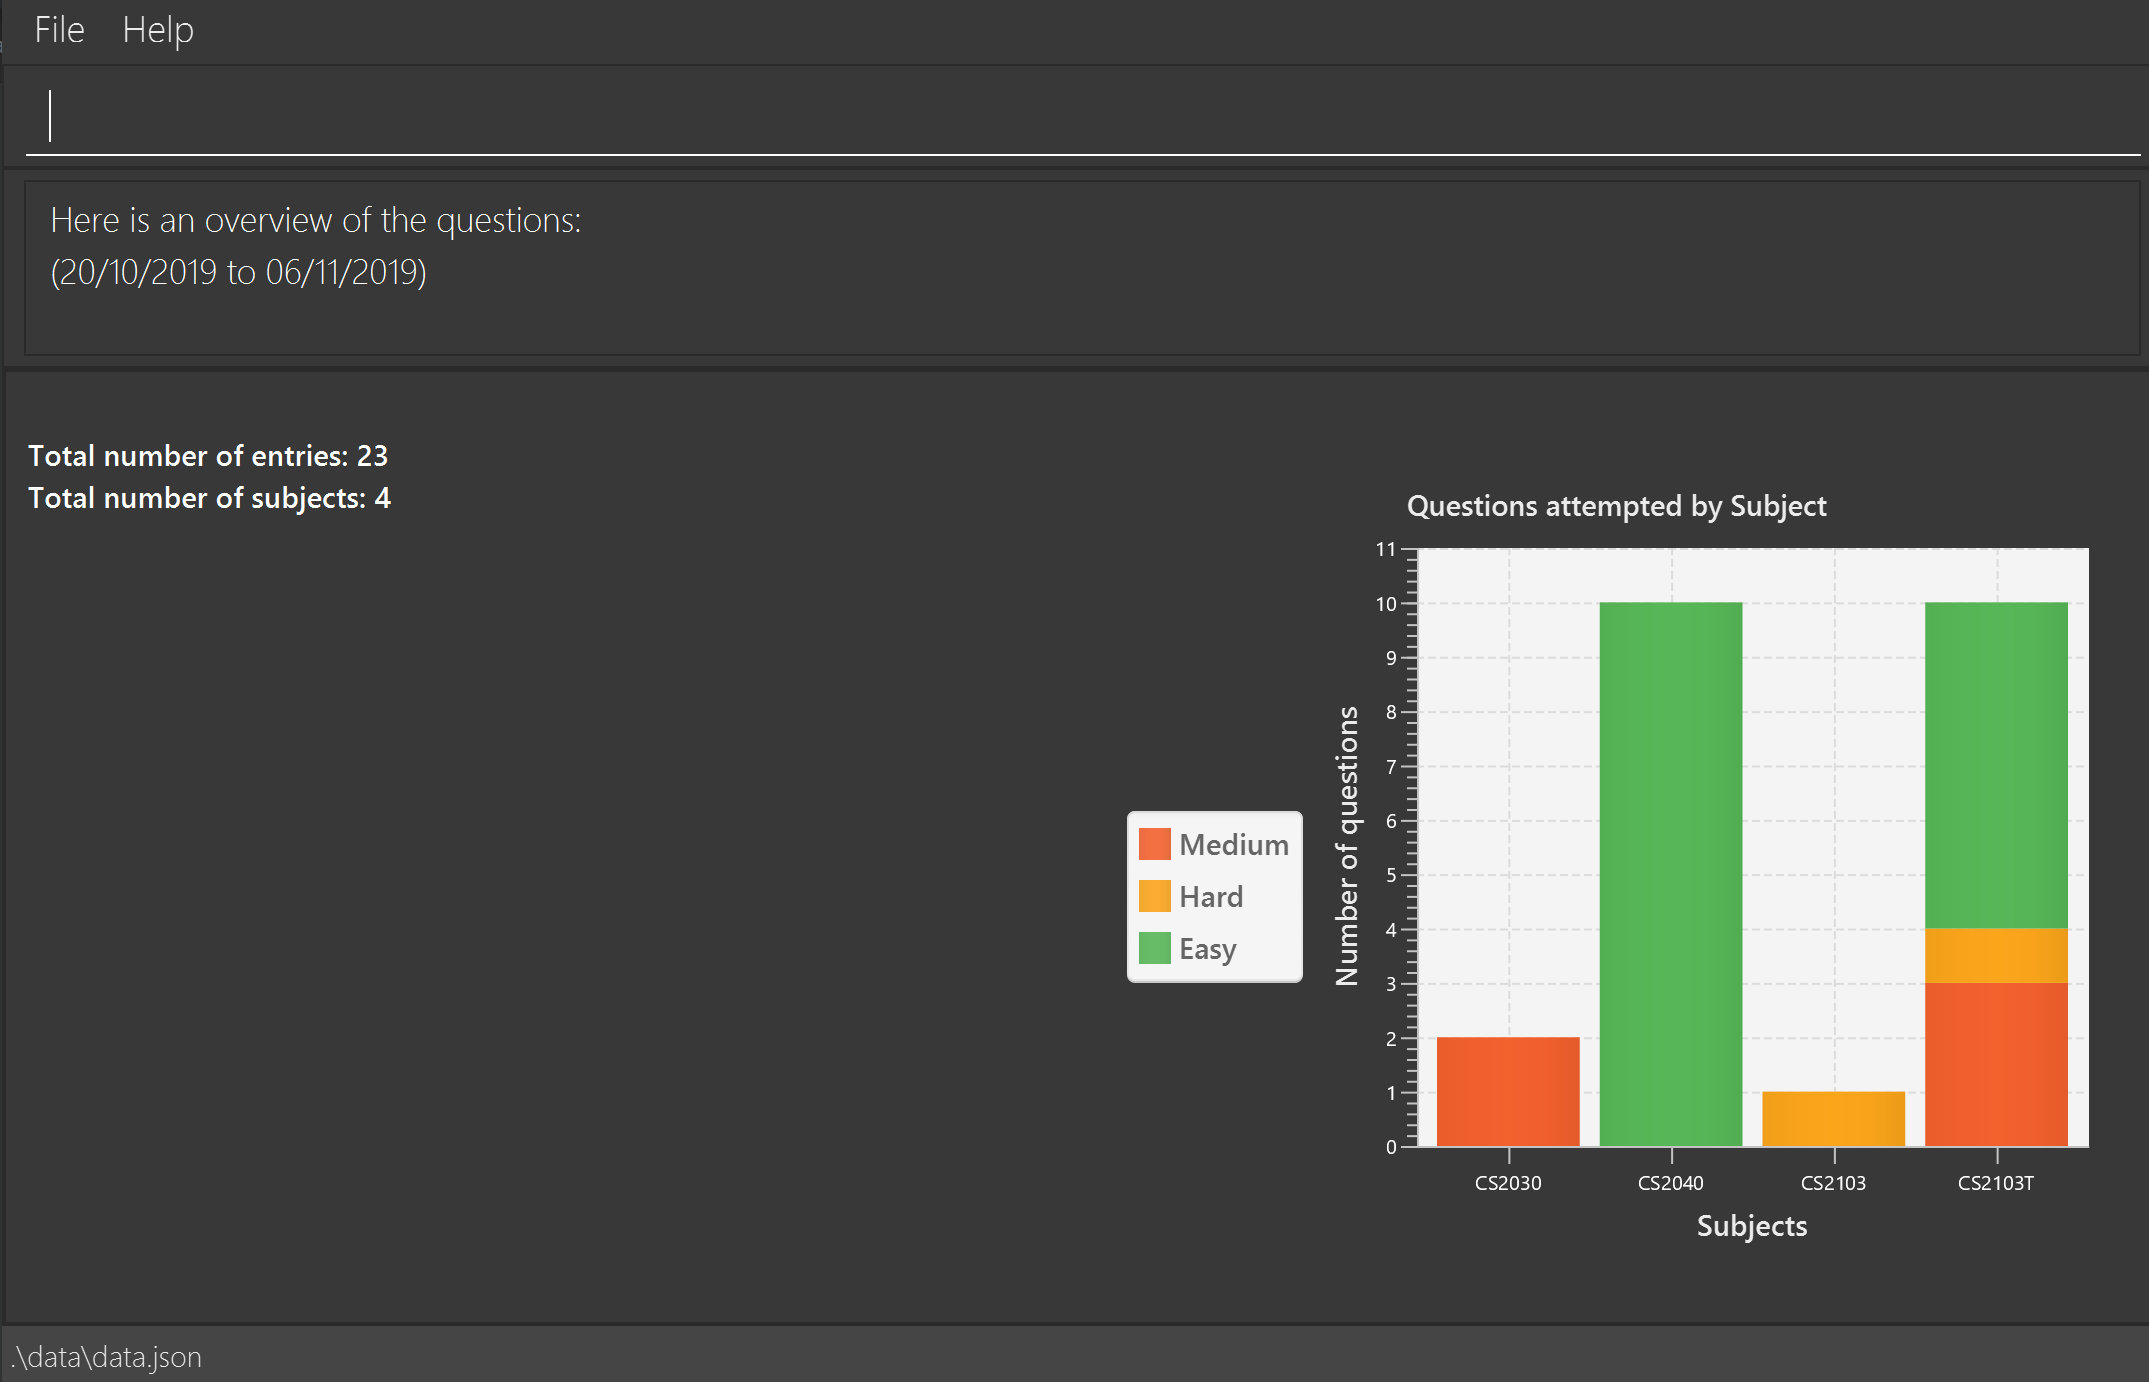
overview dt/20/10/2019 dt/06/11/2019 commandDeveloper guide contributions
We have also modified the existing AddressBook Developer Guide to include implementation of our features as well as remove the old documentation of the AddressBook features. Given below shows my additions to the NUStudy Developer Guide for the statistics feature.
Statistics feature
Implementation
The statistics feature gathers data stored from quizzes done in NUStudy to analyse and return an output. The different commands supported by the statistics feature are used to filter the type of statistics the user wants. These commands include:
-
GetQnsCommand— Gets all questions answered correctly/incorrectly. -
GetReportCommand— Returns a report of the specified question. -
GetStatisticsCommand— Returns a pie chart containing a break down of the questions by its results. -
GetOverviewCommand— Gets an overview of the types of questions that have been attempted overall.
Given below is an example usage scenario and how the statistics mechanism behaves at each step.
Step 1. The user launches the application.
The app will attempt to read past data from any quizzes done and store it internally to a quizResults list.
Step 2. The user enters stats s/CS2103T to get the statistics of all quiz questions done for CS2103T.
A GetStatisticsCommand will be created. When it is executed from the MainWindow,
it returns a new CommandResult with command type: STATS.
The following class diagram shows how the GetStatisticsCommand and CommandResult classes are related.
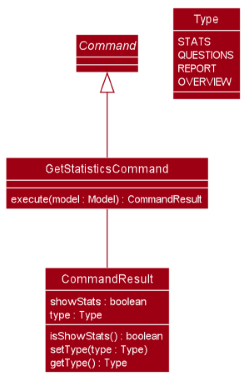
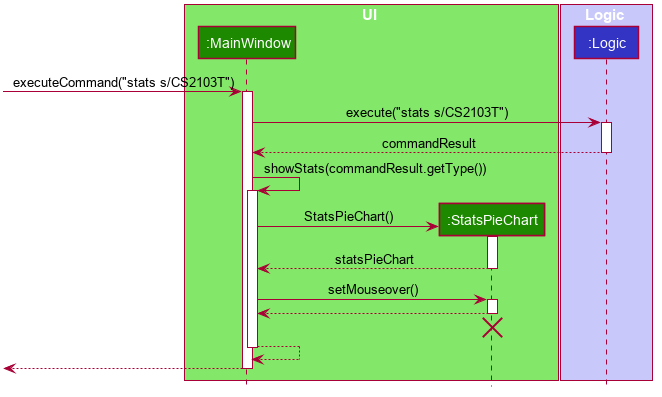
GetStatisticsCommandStep 3. After CommandResult is returned to MainWindow, it will call a showStats method to
create a pie chart. It will then show a statistics panel, hiding all notes, tasks and questions.
The following sequence diagram shows how the UI handles the GetStatisticsCommand:
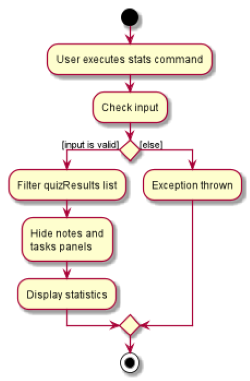
GetStatisticsCommandStep 4. The user now wants to stop viewing statistics and decides to view all notes, tasks and questions
again using the listnote command. The statistics panel will now be hidden.
The following activity diagram summarizes what happens when a user executes the statistics command:
Design Considerations
Aspect: Where statistics are shown
-
Alternative 1 (current choice): Hide all other panels and only show statistics.
-
Pros: Less scrolling will be needed and more information can be shown in one panel.
-
Cons: More methods are needed to deal with hiding and showing the different panels leading to more room for errors.
-
-
Alternative 2: Allocate a spot in the main window with the notes, tasks and questions for statistics to be displayed.
-
Pros: It is easy to implement.
-
Cons: The number of notes, tasks and questions that can be seen without scrolling will be decreased. The charts will be small and condensed making it difficult to see the data at first glance.
-
Aspect: How statistics are represented
-
Alternative 1 (current choice): Use a pie chart.
-
Pros: It is easy to read at a glance.
-
Cons: Pie chart slices may get too small to see if there are too little correct/incorrect questions done.
-
-
Alternative 2: Use a grouped bar chart.
-
Pros: The questions done are sorted by subjects, thus it is more informative.
-
Cons: As the number of subjects increases, the bars get thinner making it more difficult to see the data. This is also more difficult to implement.
-
Use case: Get statistics for subjects (Irene)
MSS
-
Student gives the command to get the statistics for a difficulty and some subjects
stats [d/DIFFICULTY] [s/SUBJECT1] [s/SUBJECT2]… -
Application returns a pie chart with number of questions answered correctly and incorrectly
Use case ends
Extensions
-
1a. Student provides an invalid difficulty or invalid subjects
-
1a1. Application will inform students that there are no statistics for that difficulty/subjects
-
1a2. Student will re-enter the command
-
Repeat 1a1 and 1a2 until valid difficulty/subjects is/are provided
-
-
Use case resumes from step 2
Use case: Get report of individual questions (Irene)
MSS
-
Student gives the command to get report of a question
report INDEX -
Application returns past attempts of the question and statistics of how well the question has been answered
Use case ends
Extensions
-
1a. Student gives an out-of-range index
-
1a1. Application displays a message indicating that the index is invalid
-
1a2. Student re-enters the command
-
Repeat 1a1 and 1a2 until a valid index is provided
-
-
Use case resumes from step 2
-
1b. Student does not provide an index
-
1b1. Application displays a message indicating that the command format is invalid
-
1b2. Student re-enters the command
-
Repeat 1b1 and 1b2 until a valid index is provided
-
-
Use case resumes from step 2